Nagios is like a watchful guardian for systems. It keeps an eye on everything from servers to networks and applications, making sure they’re working properly. If something goes wrong, like a server running out of space or an excessive number of processes. Nagios sends out alerts to let us know so they can fix the problem quickly. It’s like having a reliable alarm system for the digital world!
Always consider implementing resource monitoring and alerting mechanisms (using tools like Prometheus, Nagios, or Zabbix) to keep track of your server and to take proactive actions.
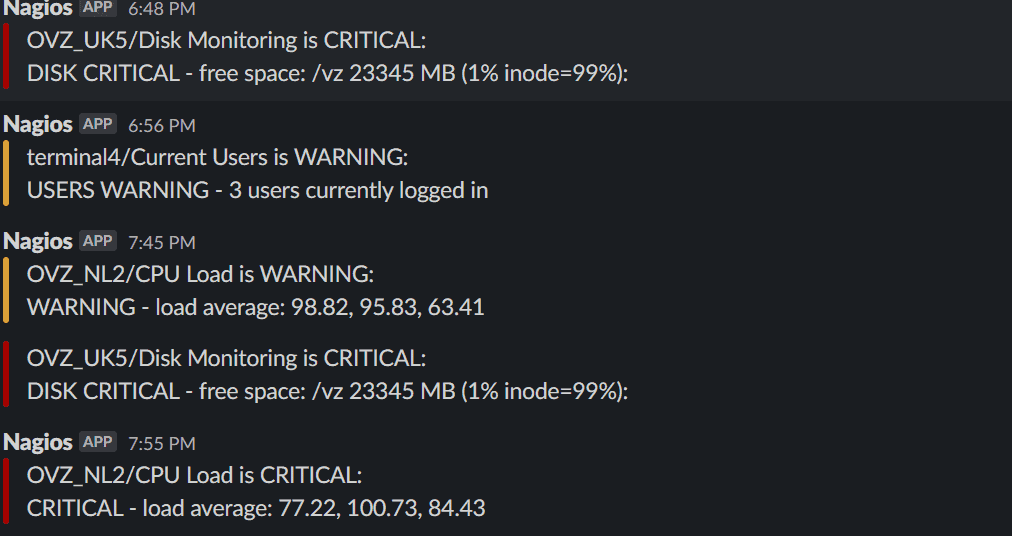
Once the nagios alert is received, we can manually check and resolve each of the Nagios alerts by using commands like top, htop, wc -l, and others:
Now we can discuss about different Alerts.
Disk monitoring
To check disk space in Linux, you can use the df -hT command, which displays information about filesystems in a human-readable format. Here’s how you can use it:
- Open a terminal on your Linux system.
- Type the following command and press Enter:
df -hTThis command will show you a list of filesystems along with their disk space usage in a human-readable format, including the filesystem type (Type), total size (Size), used space (Used), available space (Avail), percentage used (Use%), and mount point (Mounted on).
Identify Large Files and Directories:
Use commands like du -sh * in different directories to identify large files and directories consuming significant disk space. Once identified, you can decide whether to delete or archive them.
Clean Temporary Files:
Remove unnecessary temporary files using commands like sudo rm -rf /tmp/* or sudo apt clean (for Debian-based systems) to free up space.
Clear Package Cache:
If you’re using a package manager like apt, you can clear the package cache using sudo apt clean to free up space used by downloaded package files.
Current user warning
To Check who is currently logged into the server, use who command
WhoList all users on the system from the /etc/passwd file:
cat /etc/passwdCPU Load Warning
To check CPU load and monitor for warnings in Linux, you can use the top command or htop for a more interactive display.
Open a terminal and run either of the following commands:
Top Or
HtopThese commands will show you a list of processes along with CPU usage information, load averages, and more.
- Identify High CPU Usage:
Look for processes that are consuming a high percentage of CPU resources. In the top or htop output, the %CPU column shows the CPU usage of each process.
- Check Load Average:
In the top output, you’ll see load average values at the top of the screen. Load average values represent system load over 1, 5, and 15-minute intervals. High load averages indicate heavy CPU usage.
- Investigate Specific Processes:
If you identify processes with high CPU usage, investigate why they are consuming resources. Use tools like ps aux or pidstat -p <PID> to gather more information about specific processes.
Total process critical
- Use the top command to check the current system processes and their resource usage.
- Look for any processes that are consuming a disproportionately high amount of CPU, memory, or other resources.
- Note down the PID (Process ID) of the process causing the issue.
- Use the ps aux | grep <PID> command to gather more information about the process, including its command-line arguments and resource consumption.
- If the process is non-essential, consider terminating it using the kill command with the appropriate signal.
- Example: sudo kill -9 <PID> (replace <PID> with the actual Process ID).
Mail monitoring
We have already discussed about mail monitoring alert in a previous article